Using 'sf' geometries with RGraphSpace
Sysbiolab Team
2026-10-17
Source:vignettes/articles/geometries.Rmd
geometries.RmdPackage: RGraphSpace 1.5.7
# Check required version
if (packageVersion("RGraphSpace") < "1.5.7"){
  message("Need to update 'RGraphSpace' for this vignette")
  remotes::install_github("sysbiolab/RGraphSpace")
}
Overview
This tutorial demonstrates how sf geometries can be attached
to graph nodes, then either fit to the nodes as markers or normalized
into a shared coordinate space, using GraphSpace geometry
accessors.
Setting basic input data
We first construct a star-like network with nodes of different sizes.
The graph is converted to a GraphSpace object and node
coordinates are normalized.
#--- Load packages
if (!requireNamespace("sf", quietly = TRUE)) {
    install.packages("sf")
}
library("RGraphSpace")
library("igraph")
library("ggplot2")
library("sf")
library("patchwork")
# Make a toy graph
gtoy_star <- make_star(20, mode="out")

# Make a 'GraphSpace'
gs_star <- GraphSpace(gtoy_star, layout = layout_as_star(gtoy_star))

# Set node color and size
gs_star$nodeFillColor <- adjustcolor("blue", 0.1)
gs_star$nodeSize <- seq(1, gs_vcount(gs_star) )

# Normalize node coordinates
gs_star <- normalizeGraphSpace(gs_star)
# Plot with ggplot2 and RGraphSpace geoms
ggplot(gs_star) +
  geom_edgespace() +
  geom_nodespace(colour = "red") +
  theme_gspace_coords(is_norm = TRUE)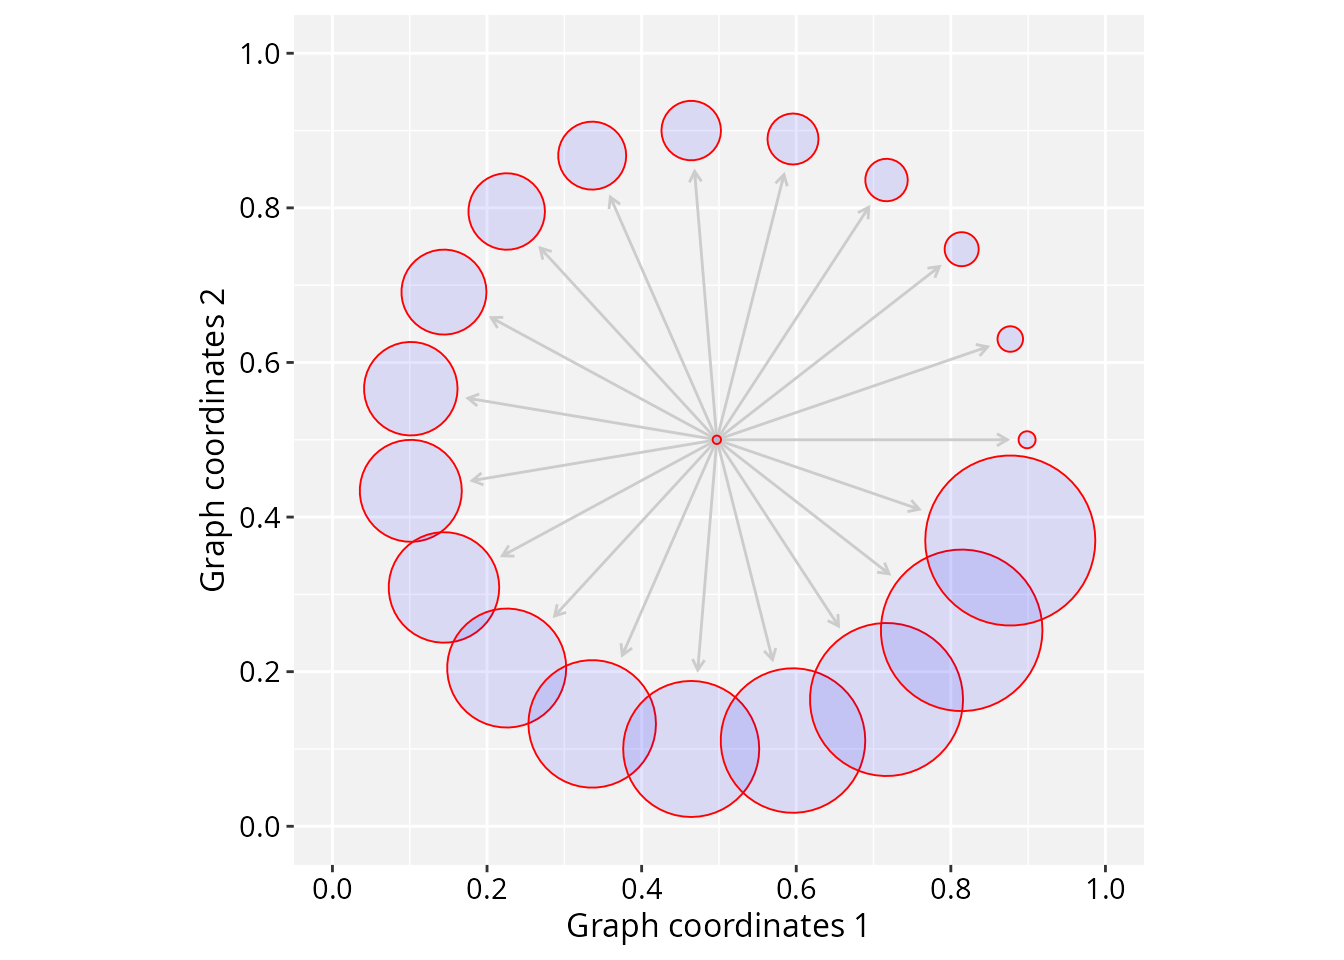
Next, we build a set of decorative sf shapes, unrelated
to the graph, with no inherent size or position of their own.
# Make some decorative shapes
shapes20 <- c( sfshape_ngons(n = 10, sides = 3:7),
  sfshape_stars(n = 10, points = 3:7) )

# Plot with ggplot2's geom_sf
ggplot(shapes20) + geom_sf() +
  ggtitle("Decorative 'sf' geometries")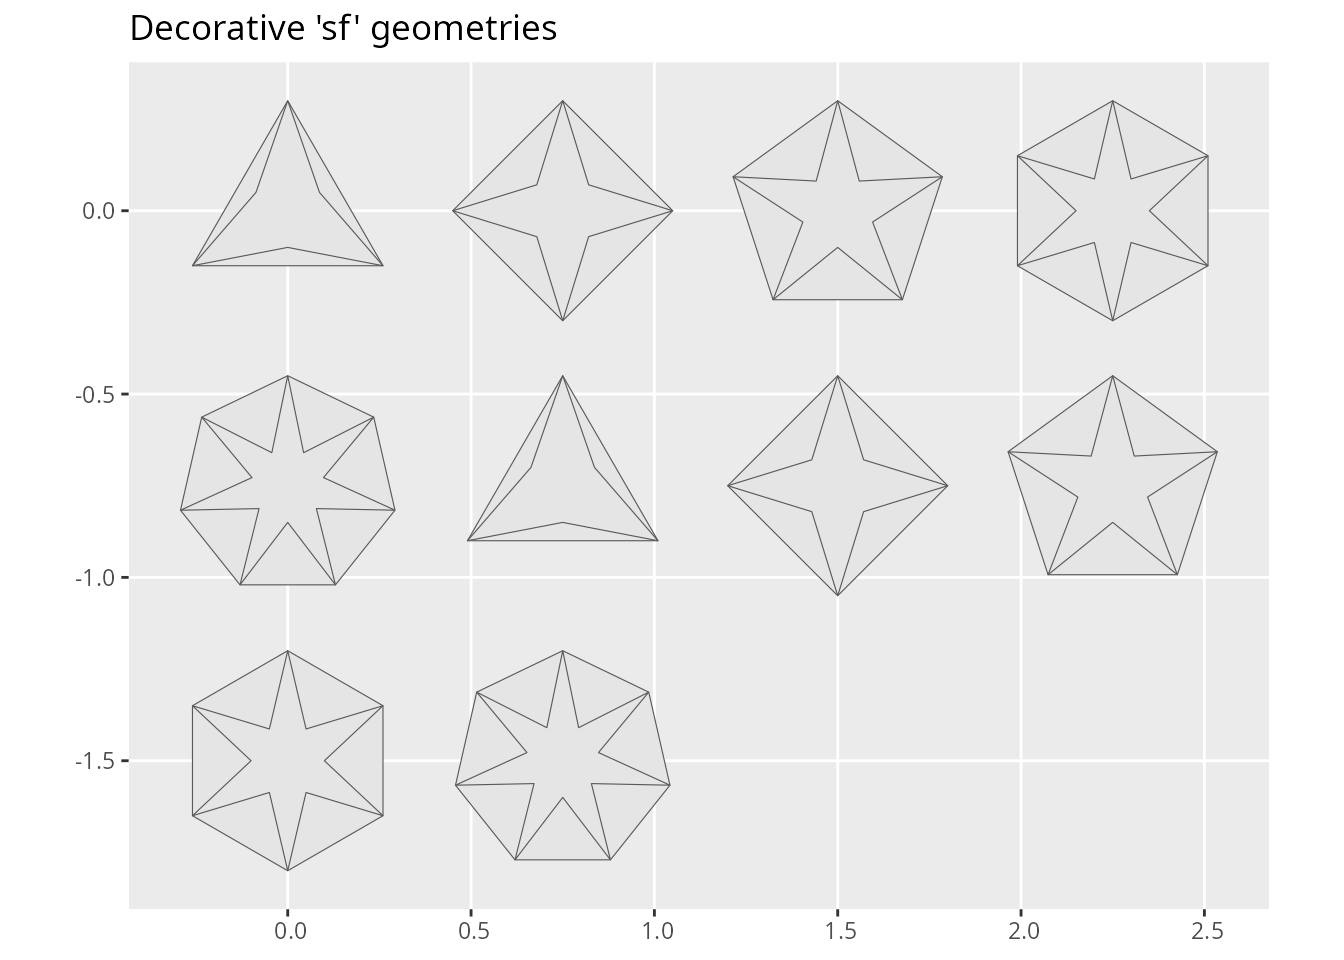
Fit geometries to nodes
We attach the geometries to the graph through the
gs_geometry() accessor, and then use
fitGeometry() to fit each shape to its corresponding
node.
# Attach the decorative shapes to the graph nodes
gs_geometry(gs_star, "geometry") <- shapes20

# Fit each shape to its node's size and position
gs_star <- fitGeometry(gs_star)
The geometries are now aligned with their nodes; positions follow the node coordinates, and sizes match the node sizes.
# Plot nodes and fitted geometries
ggplot(gs_star) +
  geom_edgespace() +
  geom_nodespace(colour = "red") +
  geom_sf(aes(geometry = geometry), fill = "blue") +
  theme_gspace_coords(is_norm = TRUE) +
  ggtitle("Decorative 'sf' geometries fit to nodes")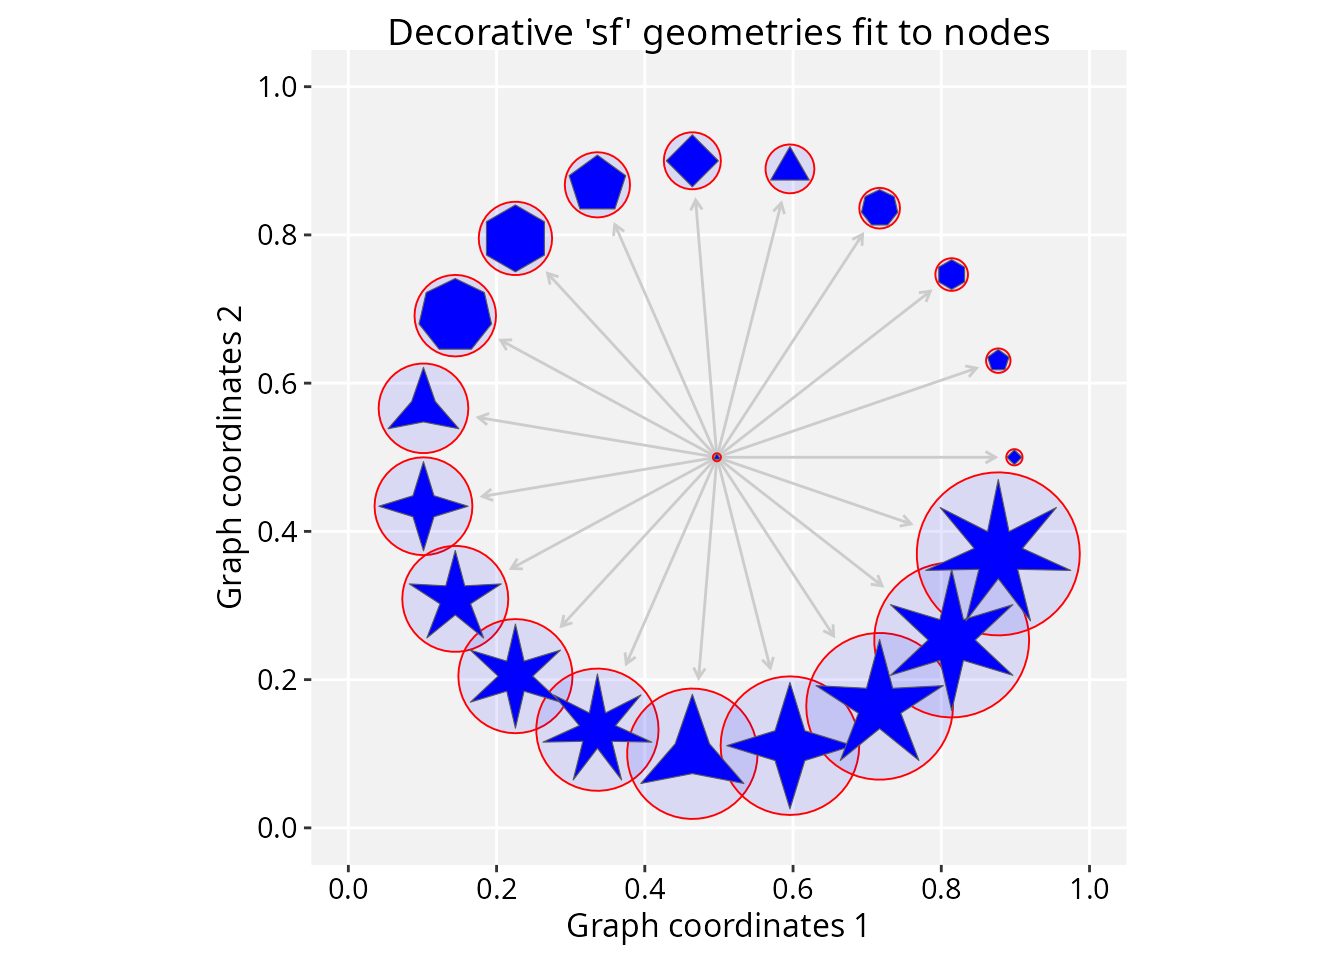
Geometry normalization
In the previous section, fitGeometry() positioned and
sized decorative shapes to match their nodes. That works because the
shapes had no coordinate space of their own. When geometries do
carry their own coordinates, fitGeometry() alone cannot
align them.
Consider a scenario in which a tissue sample is both imaged and sampled: the samples give the node coordinates, the image structures give the geometries. Both map the same tissue, so they share relative positions, but having been mapped independently, they no longer share a common scale.
The following example illustrates this scenario: nodes and geometries correspond in relative position but differ in scale. Node sizes are reset to a flat value and a scale factor is applied to node coordinates, so nodes and shapes no longer match in size or position.
gs_star2 <- gs_star

# Reset nodeSize to a flat value,
# so node-shape sizes no longer relate.
gs_star2$nodeSize <- 2

p1 <- ggplot(gs_star2) +
  geom_sf(aes(geometry = geometry), fill = "blue") +
  geom_edgespace() +
  geom_nodespace(fill = "cyan") +
  theme_gspace_coords(is_norm = TRUE) +
  ggtitle("Nodes and geometries\nwith unrelated sizes")

# Set a new scale factor to node coordinates,
# so node-shape positions also no longer relate.
# Note: this denormalizes the coordinates.
gs_scale_factor(gs_star2) <- 0.2

p2 <- ggplot(gs_star2) +
  geom_sf(aes(geometry = geometry), fill = "blue") +
  geom_edgespace() +
  geom_nodespace(fill = "cyan") +
  theme_gspace_coords(is_norm = FALSE) +
  ggtitle("Nodes and geometries\nin unrelated spaces")

# Plot the rescaled nodes over the geometries,
# so they stay visible within each shape.
p1 + p2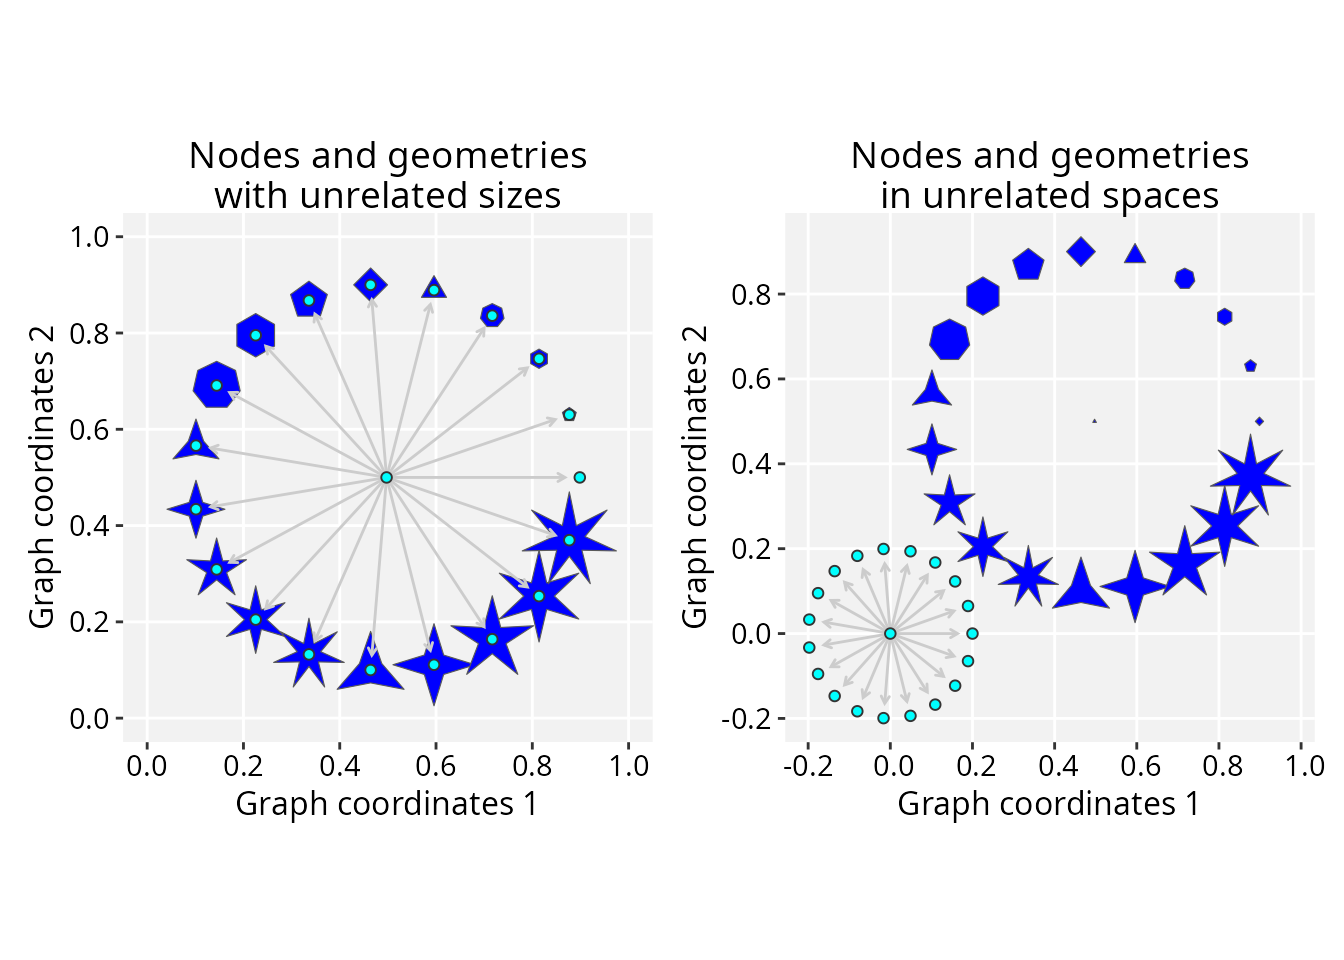
Next, we try fitGeometry(..., use_node_size = FALSE),
fitting each shape to its node without resizing. Since we reset
nodeSize to a flat value, sizing to it would be
meaningless, so only position can be recovered.
# Fit shapes to node positions, not sizes
gs_star2_fit <- fitGeometry(gs_star2, use_node_size = FALSE)

ggplot(gs_star2_fit) +
  geom_sf(aes(geometry = geometry), fill = "blue") +
  geom_edgespace() +
  geom_nodespace(fill = "cyan") +
  theme_gspace_coords(is_norm = FALSE) +
  ggtitle("Nodes and geometries aligned in position only")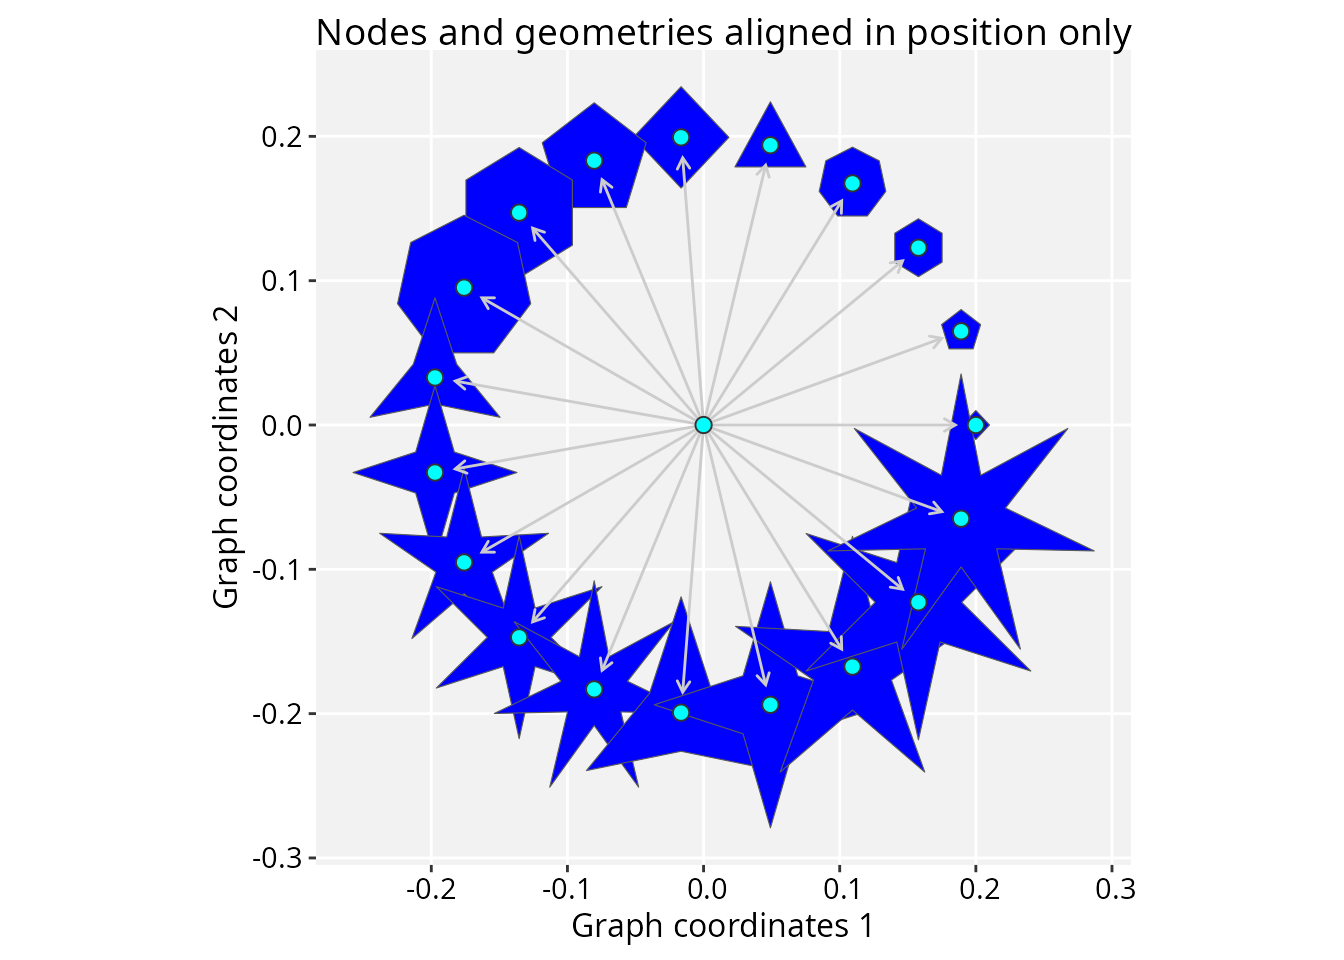
Next, we use
normalizeGraphSpace(..., norm.geometry = TRUE), which
normalizes the nodes and then calls normalizeGeometry() on
the geometry. Unlike fitGeometry(), this recovers scale
from the geometry itself: it fits a linear relationship between the
geometry’s centroids and the node coordinates, bringing both into one
common space.
# Normalize node coordinates and geometries
gs_star2_norm <- normalizeGraphSpace(gs_star2, norm.geometry = TRUE)

ggplot(gs_star2_norm) +
  geom_sf(aes(geometry = geometry), fill = "blue") +
  geom_edgespace() +
  geom_nodespace(fill = "cyan") +
  theme_gspace_coords(is_norm = TRUE) +
  ggtitle("Nodes and geometries co-normalized")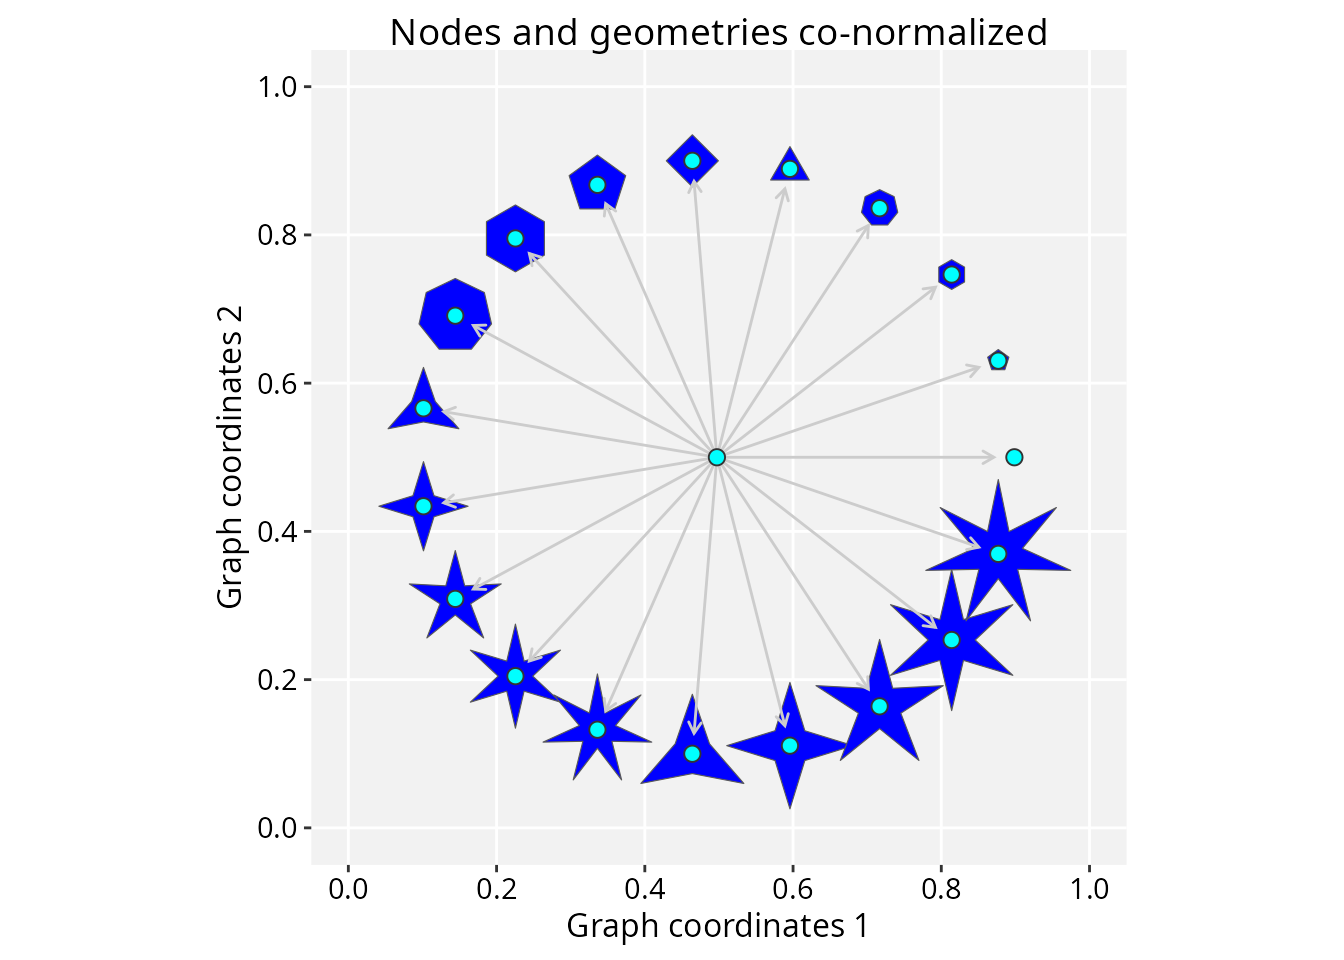
Session information
#> R version 4.6.1 (2026-06-24)
#> Platform: x86_64-pc-linux-gnu
#> Running under: Ubuntu 24.04.5 LTS
#>
#> Matrix products: default
#> BLAS:   /usr/lib/x86_64-linux-gnu/openblas-pthread/libblas.so.3
#> LAPACK: /usr/lib/x86_64-linux-gnu/openblas-pthread/libopenblasp-r0.3.26.so;  LAPACK version 3.12.0
#>
#> locale:
#>  [1] LC_CTYPE=en_US.UTF-8       LC_NUMERIC=C
#>  [3] LC_TIME=en_US.UTF-8        LC_COLLATE=en_US.UTF-8
#>  [5] LC_MONETARY=en_US.UTF-8    LC_MESSAGES=en_US.UTF-8
#>  [7] LC_PAPER=en_US.UTF-8       LC_NAME=C
#>  [9] LC_ADDRESS=C               LC_TELEPHONE=C
#> [11] LC_MEASUREMENT=en_US.UTF-8 LC_IDENTIFICATION=C
#>
#> time zone: America/Sao_Paulo
#> tzcode source: system (glibc)
#>
#> attached base packages:
#> [1] stats     graphics  grDevices utils     datasets  methods   base
#>
#> other attached packages:
#> [1] patchwork_1.3.2   sf_1.1-2          igraph_2.3.4      RGraphSpace_1.5.7
#> [5] ggplot2_4.0.3
#>
#> loaded via a namespace (and not attached):
#>  [1] tidyr_1.3.2        sass_0.4.10        generics_0.1.4     class_7.3-24
#>  [5] KernSmooth_2.23-27 lattice_0.23-1     digest_0.6.39      magrittr_2.0.5
#>  [9] evaluate_1.0.5     grid_4.6.1         RColorBrewer_1.1-3 fastmap_1.2.0
#> [13] Matrix_1.7-6       jsonlite_2.0.0     ggrastr_1.0.2      e1071_1.7-17
#> [17] DBI_1.3.0          purrr_1.2.2        scales_1.4.0       textshaping_1.0.5
#> [21] jquerylib_0.1.4    cli_3.6.6          rlang_1.3.0        units_1.0-1
#> [25] tidygraph_1.3.1    withr_3.0.3        cachem_1.1.0       yaml_2.3.12
#> [29] otel_0.2.0         ggbeeswarm_0.7.3   tools_4.6.1        dplyr_1.2.1
#> [33] vctrs_0.7.3        R6_2.6.1           proxy_0.4-29       lifecycle_1.0.5
#> [37] classInt_0.4-11    fs_2.1.0           htmlwidgets_1.6.4  vipor_0.4.7
#> [41] ragg_1.5.2         beeswarm_0.4.0     pkgconfig_2.0.3    desc_1.4.3
#> [45] pkgdown_2.2.0      bslib_0.11.0       pillar_1.11.1      gtable_0.3.6
#> [49] glue_1.8.1         Rcpp_1.1.2         systemfonts_1.3.2  xfun_0.59
#> [53] tibble_3.3.1       tidyselect_1.2.1   rstudioapi_0.19.0  knitr_1.51
#> [57] dichromat_2.0-1    farver_2.1.2       htmltools_0.5.9    rmarkdown_2.32
#> [61] compiler_4.6.1     S7_0.2.2