GraphSpace objects can be used directly with ggplot2, allowing node attributes and high-dimensional feature data to be mapped through standard aesthetic mappings without manual data extraction. This integration enables:
Lazy evaluation of node attributes and feature data.
Automatic synchronization of node metadata for standard ggplot2 geoms such as geom_point.
Automatic propagation of node metadata required for edge clipping and arrow placement in GraphSpace-native geoms.
Usage
# S3 method for class 'GraphSpace'
ggplot(data, mapping = NULL, ...)
Arguments
- data
A GraphSpace object.
- mapping
- ...
Additional arguments passed to ggplot.
Value
A gspace_plot object extending ggplot.
Details
When a GraphSpace object is supplied to ggplot(), RGraphSpace
extends the standard ggplot2 build process to automatically resolve
GraphSpace variables and synchronize node metadata required for edge
rendering.
When using ggplot(), neither nodespace_handler nor
inject_nodespace need to be called explicitly.
Examples
library(RGraphSpace)
library(igraph)
library(ggplot2)
# Generate a toy star graph
gtoy1 <- make_star(15, mode = "out")
V(gtoy1)$my_node_var <- runif(vcount(gtoy1), 1, 20)
# Create a GraphSpace object
gs <- GraphSpace(gtoy1, layout = layout_in_circle(gtoy1))
#> Validating the 'igraph' object...
#> Vertex attribute 'name' missing; assigning names...
#> Ignoring graph-level attributes: 'name', 'mode', 'center'
#> Creating a 'GraphSpace' object...
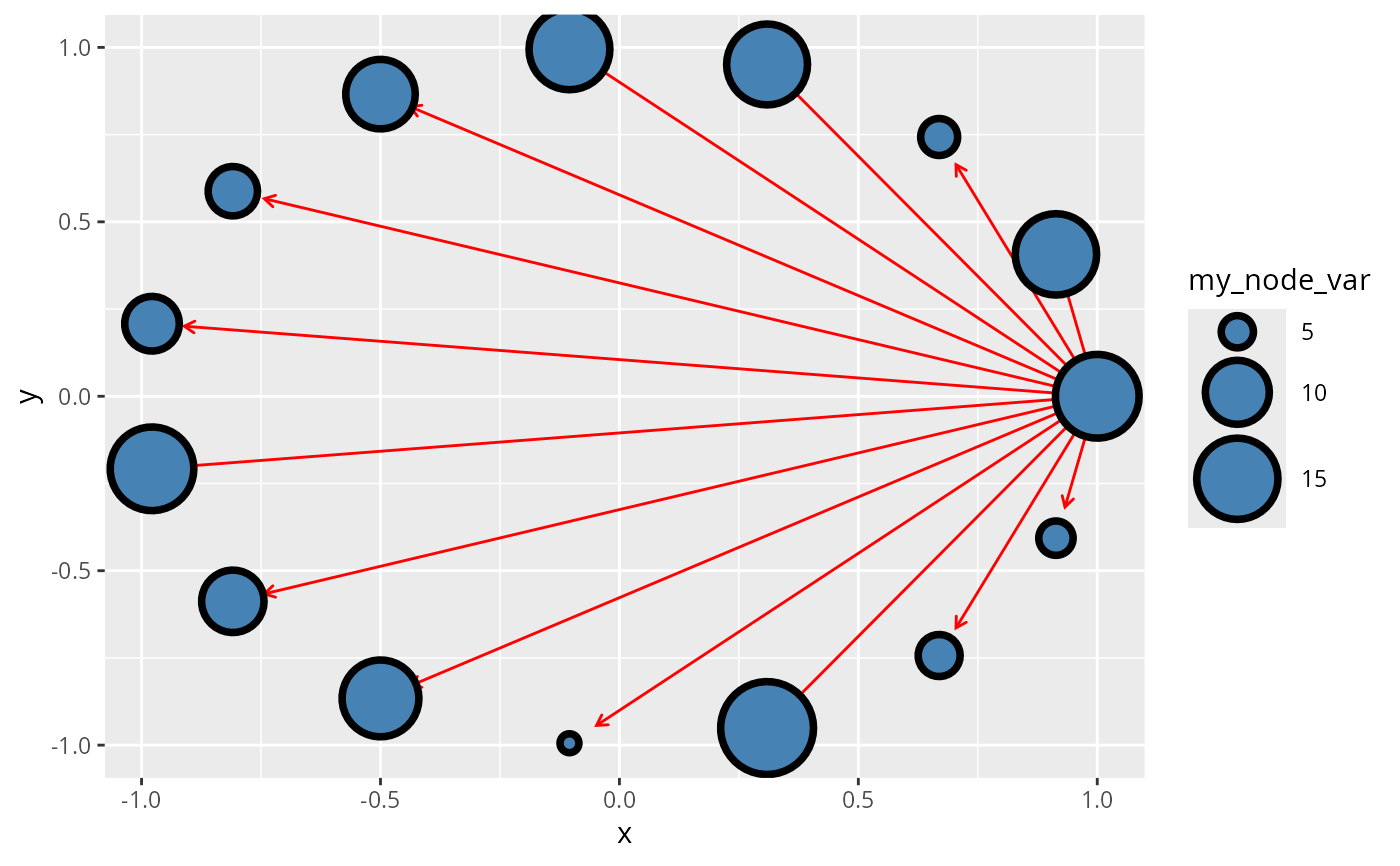
# Example 1: Using RGraphSpace-native geoms
# Edge clipping metadata are injected automatically
ggplot(gs) +
geom_edgespace(colour = "red") +
geom_nodespace(aes(size = my_node_var),
fill = "steelblue", stroke = 2) +
scale_size(range = c(2, 15))
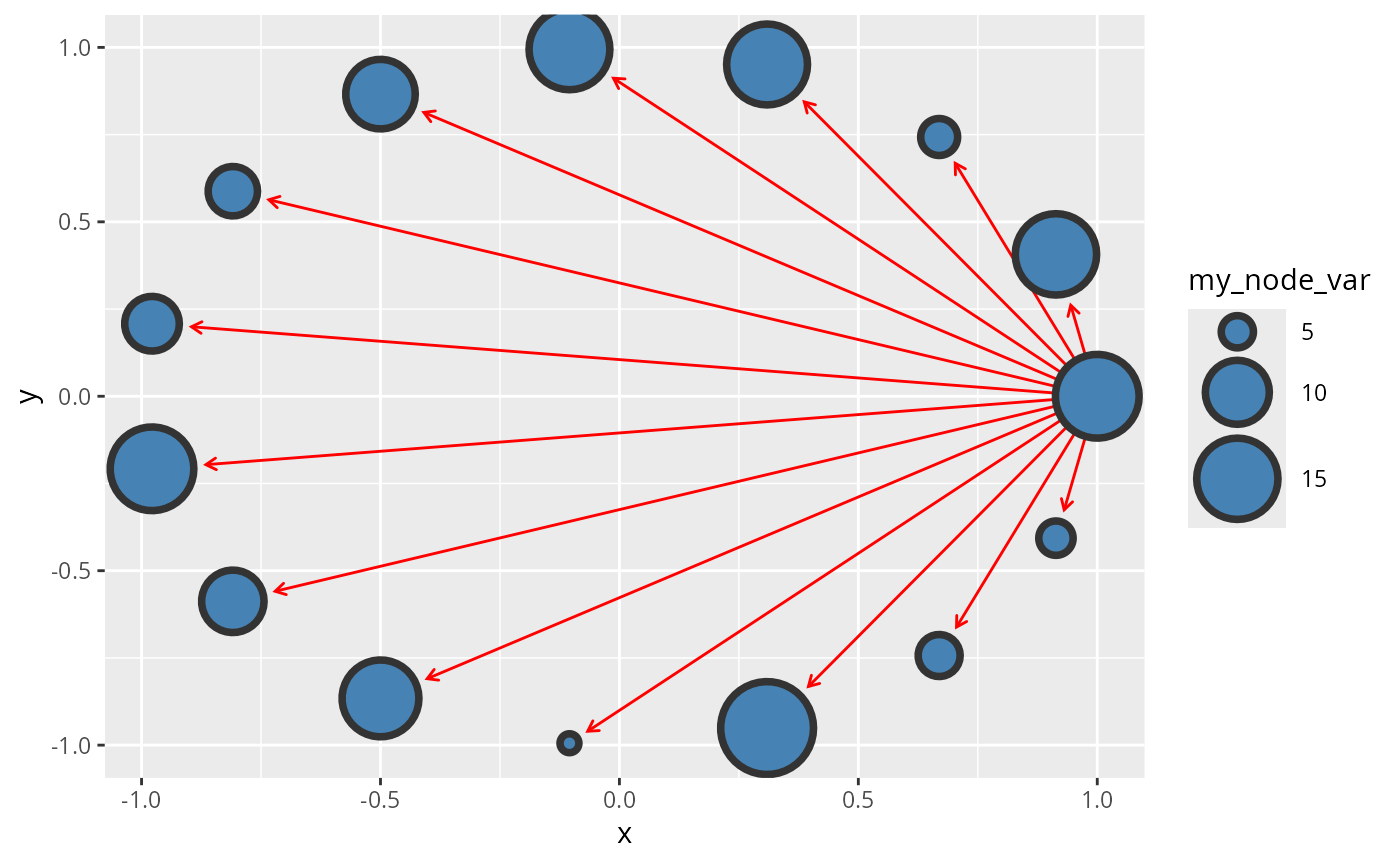 # Example 2: Mixing native and general geoms
# Note possible clipping mismatch when combining
# geom_edgespace() with generic ggplot2 node geoms.
# Since geom_point() does not expose the final rendered
# node radius to RGraphSpace, edge clipping is estimated
# from layer parameters and may not exactly match the
# displayed node geometry.
ggplot(gs) +
geom_edgespace(colour = "red") +
geom_point(aes(x, y, size = my_node_var),
fill = "steelblue", stroke = 2, shape = 21) +
scale_size(range = c(2, 15))
# Example 2: Mixing native and general geoms
# Note possible clipping mismatch when combining
# geom_edgespace() with generic ggplot2 node geoms.
# Since geom_point() does not expose the final rendered
# node radius to RGraphSpace, edge clipping is estimated
# from layer parameters and may not exactly match the
# displayed node geometry.
ggplot(gs) +
geom_edgespace(colour = "red") +
geom_point(aes(x, y, size = my_node_var),
fill = "steelblue", stroke = 2, shape = 21) +
scale_size(range = c(2, 15))