Wrapper function to plot GraphSpace objects in ggplot2
Source:R/gspace-methods.R
plotGraphSpace-methods.RdplotGraphSpace() is a High-level plotting interface that translates
igraph and GraphSpace data objects into ggplot2 layers.
Usage
# S4 method for class 'GraphSpace'
plotGraphSpace(
  gs,
  theme = "th0",
  xlab = "Graph coordinates 1",
  ylab = "Graph coordinates 2",
  node.labels = FALSE,
  label.size = 3,
  label.color = "grey20",
  add.image = TRUE,
  raster = FALSE,
  dpi = 300,
  dev = "cairo_png",
  add.labels = deprecated(),
  font.size = deprecated(),
  bg.color = deprecated()
)

# S4 method for class 'igraph'
plotGraphSpace(gs, ...)

# S4 method for class 'tbl_graph'
plotGraphSpace(gs, ...)

# S4 method for class 'gs_graph'
plotGraphSpace(gs, ...)
Arguments
- gs
Either an
igraphor GraphSpace class object. Ifgsis anigraph, then it must includex,y, andnamevertex attributes (seeGraphSpace).- theme
Name of a custom RGraphSpace theme. These themes (from 'th0' to 'th3') consist of preconfigured ggplot settings, which can be subsequently refine using
theme.- xlab
The title for the 'x' axis of a 2D-image space.
- ylab
The title for the 'y' axis of a 2D-image space.
- node.labels
Optional specification of node labels to display. If
FALSE(default), no labels are shown. IfTRUE, labels are displayed for all nodes. Otherwise, a character vector may be supplied to display labels only for the specified nodes. Character values are matched against thenodeLabelattribute.- label.size
Font size passed to
geom_text.- label.color
Color passed to
geom_text.- add.image
A logical value indicating whether to add a background image, when one is available (see
GraphSpace).- raster
A logical value indicating whether to rasterize the main plot. See
rasterisefor further specifications.- dpi
Raster resolution, in dots per inch.
- dev
Device used in the
rasterisecall.- add.labels
Deprecated. Use
node.labelsinstead.- font.size
Deprecated. Use
themecustomization instead.- bg.color
Deprecated. Use
themecustomization instead.- ...
Additional arguments passed to the
plotGraphSpacefunction.
Examples
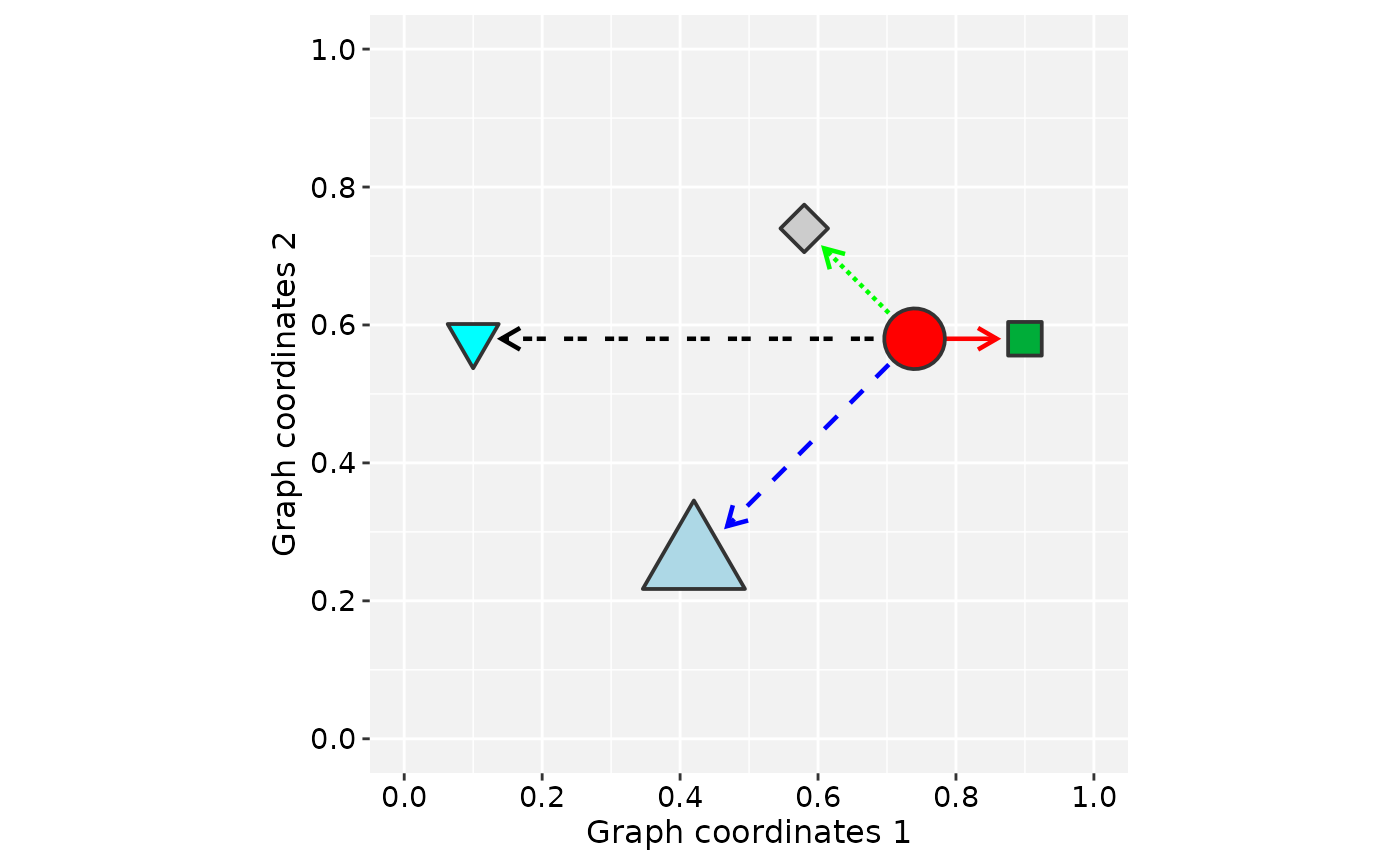
library(RGraphSpace)
library(igraph)
# Load a demo igraph
data('gtoy1', package = 'RGraphSpace')
# Generate a ggplot for gtoy1
plotGraphSpace(gtoy1, node.labels = TRUE)
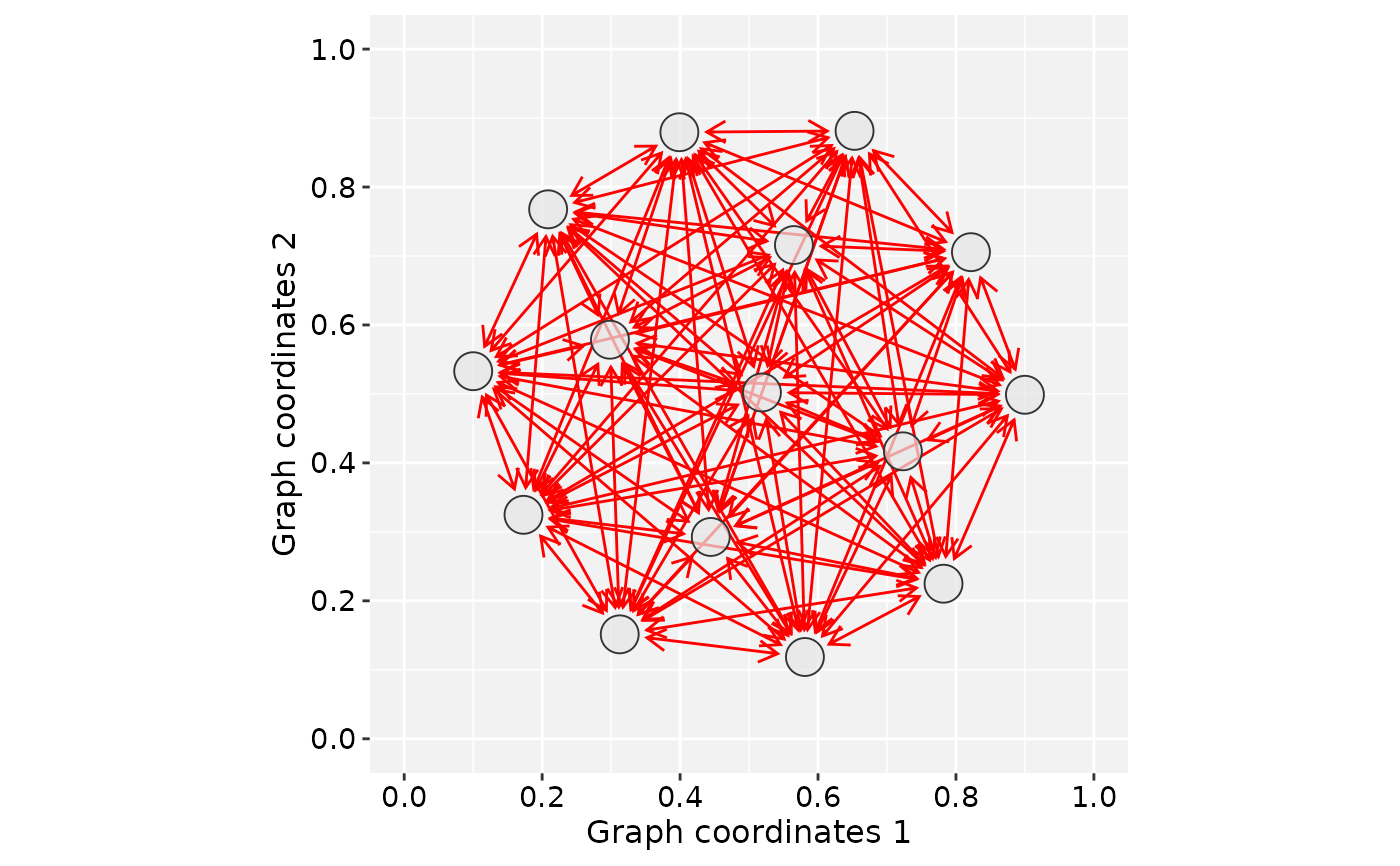
 # Create a star graph
gtoy_star <- make_full_graph(15)
# Example of setting node and edge attributes
V(gtoy_star)$nodeSize <- 5
E(gtoy_star)$edgeColor <- "red"
E(gtoy_star)$arrowType <- "<->"
# Create a GraphSpace object
gs_star <- GraphSpace(gtoy_star)
#> Validating the 'igraph' object...
#> Vertex attributes 'x' and 'y' missing; computing layout...
#> Vertex attribute 'name' missing; assigning names...
#> Ignoring graph-level attributes: 'name', 'loops'
#> Creating a 'GraphSpace' object...
# Normalize graph coordinates
gs_star <- normalizeGraphSpace(gs_star)
#> Normalizing node coordinates to graph space...
# Generate a ggplot for gs_star
plotGraphSpace(gs_star)
# Create a star graph
gtoy_star <- make_full_graph(15)
# Example of setting node and edge attributes
V(gtoy_star)$nodeSize <- 5
E(gtoy_star)$edgeColor <- "red"
E(gtoy_star)$arrowType <- "<->"
# Create a GraphSpace object
gs_star <- GraphSpace(gtoy_star)
#> Validating the 'igraph' object...
#> Vertex attributes 'x' and 'y' missing; computing layout...
#> Vertex attribute 'name' missing; assigning names...
#> Ignoring graph-level attributes: 'name', 'loops'
#> Creating a 'GraphSpace' object...
# Normalize graph coordinates
gs_star <- normalizeGraphSpace(gs_star)
#> Normalizing node coordinates to graph space...
# Generate a ggplot for gs_star
plotGraphSpace(gs_star)