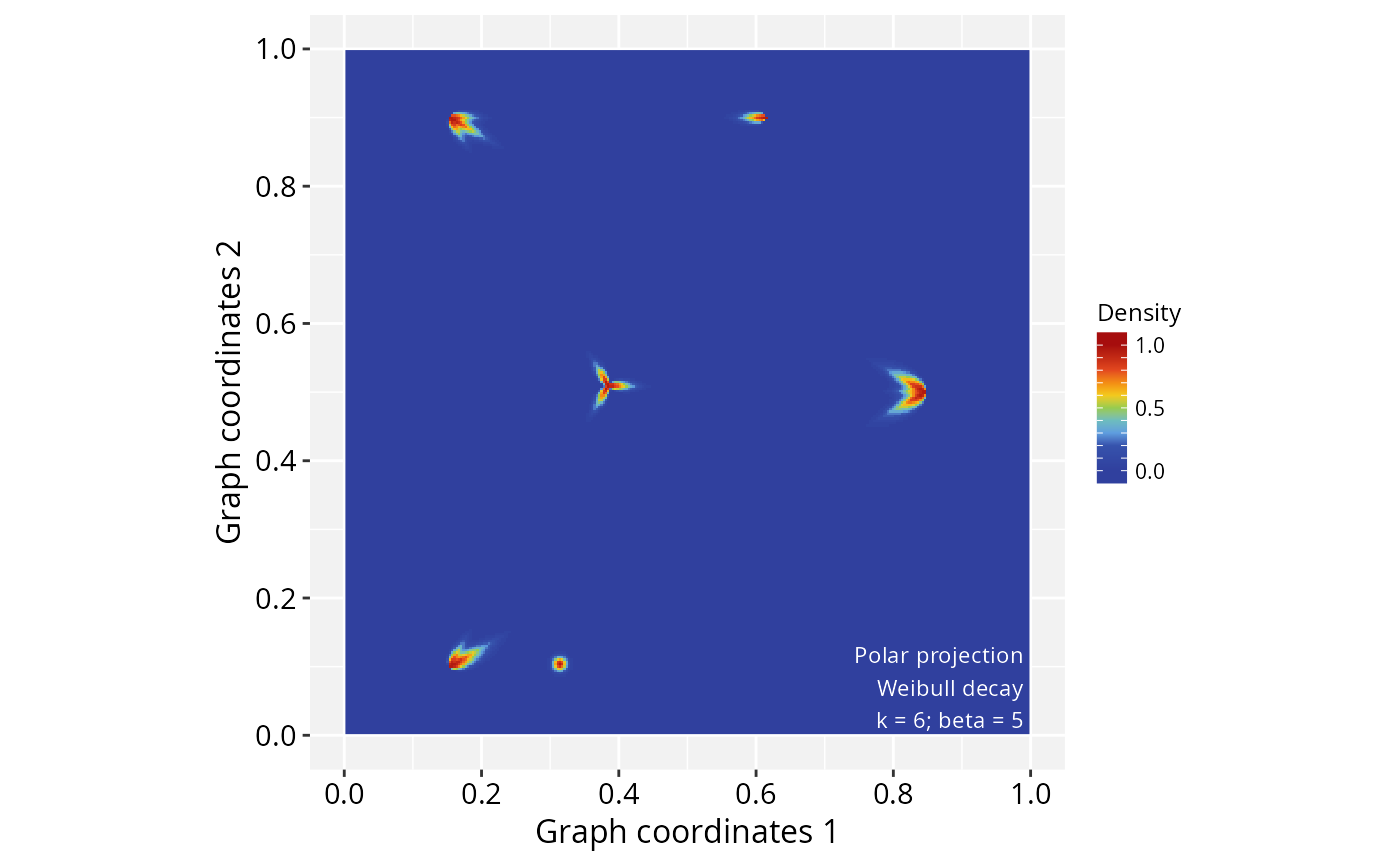
polarProjection() implements a convolution algorithm to project
vertex-associated signals onto a 2D image space along graph edges, using
a polar decay function.
Usage
# S4 method for class 'PathwaySpace'
polarProjection(
  ps,
  feature = activeFeature(ps),
  decay.fun = weibullDecay(pdist = 1),
  aggregate.fun = signalAggregation(),
  polar.fun = polarDecay(),
  k = gs_vcount(ps),
  beta = 10,
  directional = FALSE,
  edge.norm = TRUE,
  rescale = TRUE,
  verbose = TRUE,
  pdist = deprecated()
)
Arguments
- ps
A PathwaySpace class object.
- feature
A single string specifying the feature to project as a signal. Must match either a feature name (see
gs_features(ps)) or a node attribute (seegs_names(ps)). If a node attribute, make sure it is of numeric type. If the signal does not come from internal features, assign it directly using thevertexSignalaccessor.- decay.fun
A signal decay function. Available options include 'Weibull', 'exponential', and 'linear' (see
weibullDecay). Users may also define a custom decay model with at least two arguments, e.g.,function(x, signal) { ... }, which should returns a vector of projected signals of the same length asx. Additional arguments may include any variable available as a graph vertex attribute.- aggregate.fun
A function used to aggregate the projected signals. It must be provided as a unary function, e.g.,
function(x) { ... }, which should aggregate a vector of signals to a scalar value. Available options include 'mean', 'wmean', 'log.wmean', and 'exp.wmean' (SeesignalAggregation).- polar.fun
A polar decay function (see
polarDecay).- k
A single positive integer specifying the maximum number of vertices whose signals contribute to the projection. Defaults to
gs_vcount(ps), i.e. all vertices are considered. Specifically, at each point in space, the k-top decayed signals are retained prior to aggregation. Reducing k focuses the projection on the strongest local signals, filtering out weaker contributions.- beta
An exponent (in
>=0)) used in the polar projection functions (seepolarDecay). It controls the shape of the polar projection by modulating the angular span. For example, \(beta = 0\) yields a circular projection, \(beta = 1\) produces a cardioid-like shape, andbeta > 1progressively narrows the projection along a reference edge axis.- directional
If directional edges are available, this argument can be used to orientate the signal projection on directed graphs.
- edge.norm
Scale distances based on edge lengths (when
edge.norm=TRUE) or based on full coordinate space (whenedge.norm=FALSE).- rescale
A logical value indicating whether to rescale the signal. If the signal
>=0, then it will be rescaled to[0, 1]; if the signal<=0, then it will be rescaled to[-1, 0]; and if the signal in(-Inf, +Inf), then it will be rescaled to[-1, 1].- verbose
A logical value specifying to display detailed messages (when
verbose=TRUE) or not (whenverbose=FALSE).- pdist
Deprecated as of PathwaySpace 1.0.2; this parameter is now passed internally through
decay.fun.
Value
A preprocessed PathwaySpace class object.
Details
Nodes without edges (isolated nodes) still receive a projection: their
signal is spread as a circle whose area matches that of a minimally
connected (degree-1) node, so isolated nodes do not appear
disproportionately large or small relative to connected ones. This
treatment is the same whether directional is TRUE or
FALSE. The area-matching guarantee is derived for the default
polarDecay("power") method; it is not guaranteed to hold exactly
for the "gaussian" or "logistic" alternatives.
Examples
library(PathwaySpace)

# Load a demo igraph
data('gtoy2', package = 'RGraphSpace')

# Create a new PathwaySpace object
ps <- buildPathwaySpace(gtoy2, nrc = 300)
#> Validating arguments...
#> Validating the 'igraph' object...
#> Normalizing node coordinates to graph space...
#> Creating a 'PathwaySpace' object...
# note: adjust 'nrc' to increase image resolution

# Set '1s' as vertex signal
vertexSignal(ps) <- 1

# Set edge weight
# gs_edge_attr(ps, "weight") <- c(-1, 1, 1, 1, 1, 1)

# Set a decay function for all vertices
vertexDecay(ps) <- weibullDecay(shape=2, pdist = 0.2)

# Create a 2D-landscape image
ps <- polarProjection(ps, beta = 5)
#> Validating arguments...
#> Using polar projection on undirected graph...
#> Mapping 'x' and 'y' coordinates...
#> Computing linear and angular distances...
#> Running signal convolution...

plotPathwaySpace(ps)