PathwaySpace Overview
Sysbiolab Team
2026-06-23
Source:vignettes/articles/overview.Rmd
overview.RmdFor a given igraph object containing vertices, edges, and a
signal associated with the vertices, PathwaySpace performs a
convolution operation, which involves a weighted combination of
neighboring signals on a graph. Figure 1A illustrates
the convolution operation problem. Each vertex’s signal is positioned on
a grid at specific x and y coordinates,
represented by cones (for available signals) or question marks (for null
or missing values).
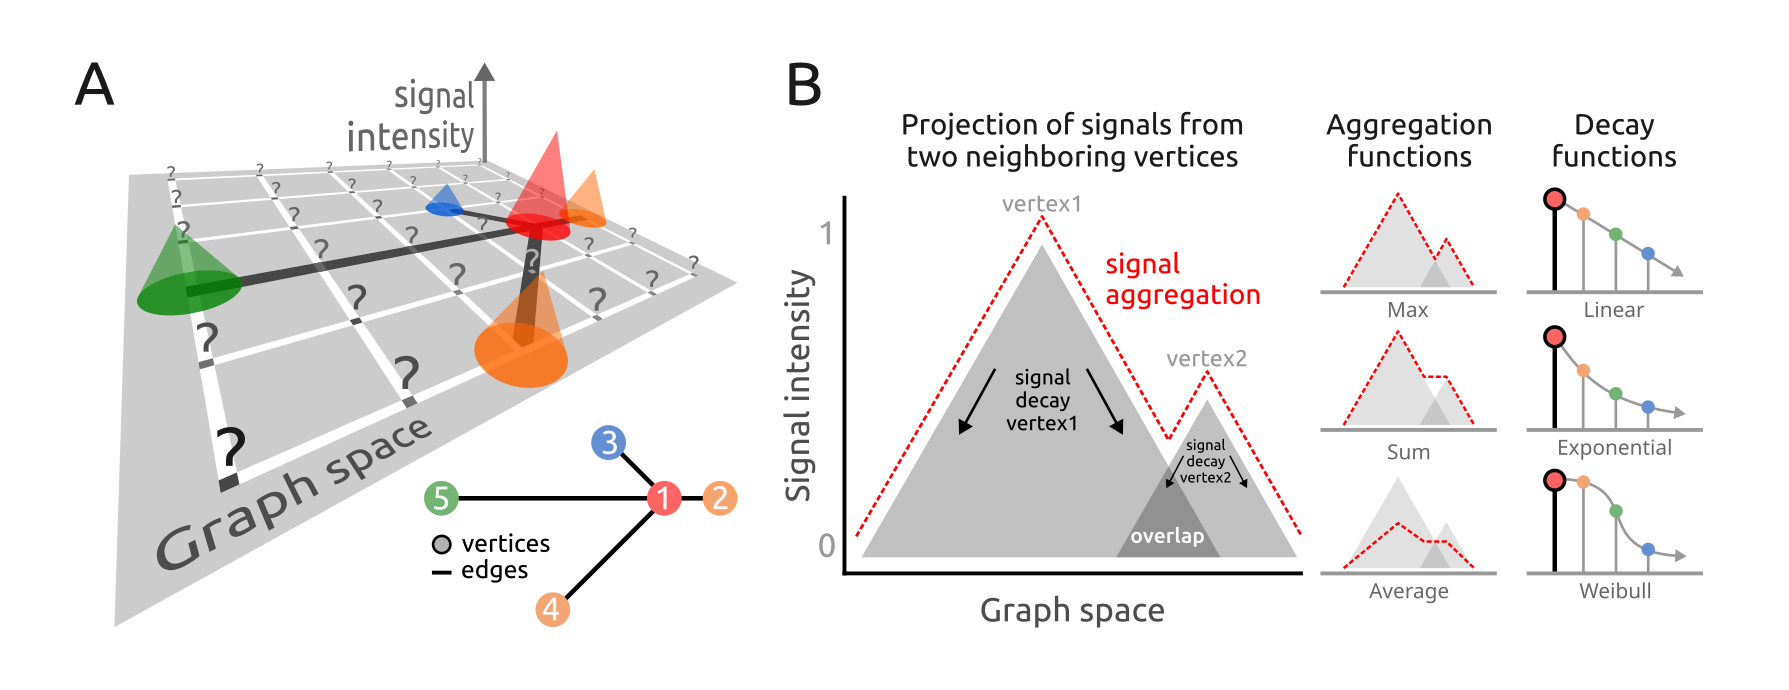 Figure 1. Signal processing addressed by the
PathwaySpace package. A) Graph overlaid on a
2D coordinate system. Each projection cone represents the signal
associated with a graph vertex (referred to as vertex-signal
positions), while question marks indicate positions with no signal
information (referred to as null-signal positions).
Inset: Graph layout of the toy example used in the
quick start section of this vignette. B)
Illustration of signal projection from two neighboring vertices,
simplified to one dimension. Right: Signal profiles
from aggregation and decay functions.
Figure 1. Signal processing addressed by the
PathwaySpace package. A) Graph overlaid on a
2D coordinate system. Each projection cone represents the signal
associated with a graph vertex (referred to as vertex-signal
positions), while question marks indicate positions with no signal
information (referred to as null-signal positions).
Inset: Graph layout of the toy example used in the
quick start section of this vignette. B)
Illustration of signal projection from two neighboring vertices,
simplified to one dimension. Right: Signal profiles
from aggregation and decay functions.